32 混合效应模型
\[ \def\bm#1{{\boldsymbol #1}} \]
最好找 3 个真实数据集,其中数据集 sleepstudy 和 cbpp 均来自 lme4 包。
32.1 线性混合效应模型
32.1.1 频率派
32.1.1.1 nlme
data(sleepstudy, package = "lme4")
library(nlme)
fm1 <- lme(Reaction ~ Days, random = ~ Days | Subject, data = sleepstudy)
summary(fm1)
Linear mixed-effects model fit by REML
Data: sleepstudy
AIC BIC logLik
1755.628 1774.719 -871.8141
Random effects:
Formula: ~Days | Subject
Structure: General positive-definite, Log-Cholesky parametrization
StdDev Corr
(Intercept) 24.740241 (Intr)
Days 5.922103 0.066
Residual 25.591843
Fixed effects: Reaction ~ Days
Value Std.Error DF t-value p-value
(Intercept) 251.40510 6.824516 161 36.83853 0
Days 10.46729 1.545783 161 6.77151 0
Correlation:
(Intr)
Days -0.138
Standardized Within-Group Residuals:
Min Q1 Med Q3 Max
-3.95355735 -0.46339976 0.02311783 0.46339621 5.17925089
Number of Observations: 180
Number of Groups: 18 32.1.1.2 lme4
或使用 lme4 包,可以得到同样的结果
Linear mixed model fit by REML ['lmerMod']
Formula: Reaction ~ Days + (Days | Subject)
   Data: sleepstudy

REML criterion at convergence: 1743.6

Scaled residuals:
    Min      1Q  Median      3Q     Max
-3.9536 -0.4634  0.0231  0.4634  5.1793

Random effects:
 Groups   Name        Variance Std.Dev. Corr
 Subject  (Intercept) 612.10   24.741
          Days         35.07    5.922   0.07
 Residual             654.94   25.592
Number of obs: 180, groups:  Subject, 18

Fixed effects:
            Estimate Std. Error t value
(Intercept)  251.405      6.825  36.838
Days          10.467      1.546   6.771

Correlation of Fixed Effects:
     (Intr)
Days -0.138
32.1.2 贝叶斯派
32.1.2.1 cmdstanr
32.1.2.2 brms
 Family: gaussian
  Links: mu = identity; sigma = identity
Formula: Reaction ~ Days + (Days | Subject)
   Data: sleepstudy (Number of observations: 180)
  Draws: 4 chains, each with iter = 2000; warmup = 1000; thin = 1;
         total post-warmup draws = 4000

Group-Level Effects:
~Subject (Number of levels: 18)
                    Estimate Est.Error l-95% CI u-95% CI Rhat Bulk_ESS Tail_ESS
sd(Intercept)          27.01      6.91    15.27    42.82 1.00     1655     2080
sd(Days)                6.54      1.51     4.15     9.93 1.00     1359     1917
cor(Intercept,Days)     0.08      0.30    -0.49     0.67 1.00      972     1465

Population-Level Effects:
          Estimate Est.Error l-95% CI u-95% CI Rhat Bulk_ESS Tail_ESS
Intercept   251.17      7.65   235.76   266.45 1.00     1958     2029
Days         10.37      1.72     7.01    13.81 1.00     1351     1999

Family Specific Parameters:
      Estimate Est.Error l-95% CI u-95% CI Rhat Bulk_ESS Tail_ESS
sigma    25.93      1.59    23.07    29.29 1.00     3005     2780

Draws were sampled using sampling(NUTS). For each parameter, Bulk_ESS
and Tail_ESS are effective sample size measures, and Rhat is the potential
scale reduction factor on split chains (at convergence, Rhat = 1).Computed from 4000 by 180 log-likelihood matrix
Estimate SE
elpd_loo -861.7 22.6
p_loo 34.6 8.7
looic 1723.4 45.2
------
Monte Carlo SE of elpd_loo is NA.
Pareto k diagnostic values:
Count Pct. Min. n_eff
(-Inf, 0.5] (good) 170 94.4% 592
(0.5, 0.7] (ok) 7 3.9% 571
(0.7, 1] (bad) 1 0.6% 46
(1, Inf) (very bad) 2 1.1% 7
See help('pareto-k-diagnostic') for details.
Warning message:
Found 3 observations with a pareto_k > 0.7 in model 'bm'. It is recommended to set 'moment_match = TRUE' in order to perform moment matching for problematic observations. 32.2 广义线性混合效应模型
二项分布
32.2.1 频率派
32.2.1.1 GLMMadaptive
data(cbpp, package = "lme4")
library(GLMMadaptive)
fgm1 <- mixed_model(
  fixed = cbind(incidence, size - incidence) ~ period,
  random = ~ 1 | herd, data = cbpp, family = binomial(link = "logit")
)
summary(fgm1)
Call:
mixed_model(fixed = cbind(incidence, size - incidence) ~ period,
    random = ~1 | herd, data = cbpp, family = binomial(link = "logit"))

Data Descriptives:
Number of Observations: 56
Number of Groups: 15

Model:
 family: binomial
 link: logit

Fit statistics:
   log.Lik      AIC     BIC
 -91.98337 193.9667 197.507

Random effects covariance matrix:
               StdDev
(Intercept) 0.6475934

Fixed effects:
            Estimate Std.Err z-value    p-value
(Intercept)  -1.3995  0.2335 -5.9923    < 1e-04
period2      -0.9914  0.3068 -3.2316 0.00123091
period3      -1.1278  0.3268 -3.4513 0.00055793
period4      -1.5795  0.4276 -3.6937 0.00022101

Integration:
method: adaptive Gauss-Hermite quadrature rule
quadrature points: 11

Optimization:
method: EM
converged: TRUE
32.2.1.2 lme4
或使用 lme4 包,可以得到同样的结果
fgm2 <- lme4::glmer(
  cbind(incidence, size - incidence) ~ period + (1 | herd),
  family = binomial("logit"), data = cbpp
)
summary(fgm2)
Generalized linear mixed model fit by maximum likelihood (Laplace
Approximation) [glmerMod]
Family: binomial ( logit )
Formula: cbind(incidence, size - incidence) ~ period + (1 | herd)
Data: cbpp
AIC BIC logLik deviance df.resid
194.1 204.2 -92.0 184.1 51
Scaled residuals:
Min 1Q Median 3Q Max
-2.3816 -0.7889 -0.2026 0.5142 2.8791
Random effects:
Groups Name Variance Std.Dev.
herd (Intercept) 0.4123 0.6421
Number of obs: 56, groups: herd, 15
Fixed effects:
Estimate Std. Error z value Pr(>|z|)
(Intercept) -1.3983 0.2312 -6.048 1.47e-09 ***
period2 -0.9919 0.3032 -3.272 0.001068 **
period3 -1.1282 0.3228 -3.495 0.000474 ***
period4 -1.5797 0.4220 -3.743 0.000182 ***
---
Signif. codes: 0 '***' 0.001 '**' 0.01 '*' 0.05 '.' 0.1 ' ' 1
Correlation of Fixed Effects:
(Intr) perid2 perid3
period2 -0.363
period3 -0.340 0.280
period4 -0.260 0.213 0.19832.2.1.3 mgcv
或使用 mgcv 包,可以得到近似的结果。随机效应部分可以看作可加的惩罚项
library(mgcv)
fgm3 <- gam(
  cbind(incidence, size - incidence) ~ period + s(herd, bs = "re"),
  data = cbpp, family = binomial(link = "logit"), method = "REML"
)
summary(fgm3)
Family: binomial
Link function: logit

Formula:
cbind(incidence, size - incidence) ~ period + s(herd, bs = "re")

Parametric coefficients:
            Estimate Std. Error z value Pr(>|z|)
(Intercept)  -1.3670     0.2358  -5.799 6.69e-09 ***
period2      -0.9693     0.3040  -3.189 0.001428 **
period3      -1.1045     0.3241  -3.407 0.000656 ***
period4      -1.5519     0.4251  -3.651 0.000261 ***
---
Signif. codes:  0 '***' 0.001 '**' 0.01 '*' 0.05 '.' 0.1 ' ' 1

Approximate significance of smooth terms:
         edf Ref.df Chi.sq  p-value
s(herd) 9.66     14  32.03 3.21e-05 ***
---
Signif. codes:  0 '***' 0.001 '**' 0.01 '*' 0.05 '.' 0.1 ' ' 1

R-sq.(adj) =  0.515   Deviance explained =   53%
-REML = 93.199  Scale est. = 1         n = 56
下面给出随机效应的标准差的估计及其上下限,和前面 GLMMadaptive 包和 lme4 包给出的结果也是接近的。
32.2.2 贝叶斯派
32.2.2.1 cmdstanr
32.2.2.2 brms
32.3 广义可加混合效应模型
从线性到可加,意味着从线性到非线性,可加模型容纳非线性的成分,比如高斯过程、样条。
32.3.1 频率派
32.3.1.1 mgcv (gam)
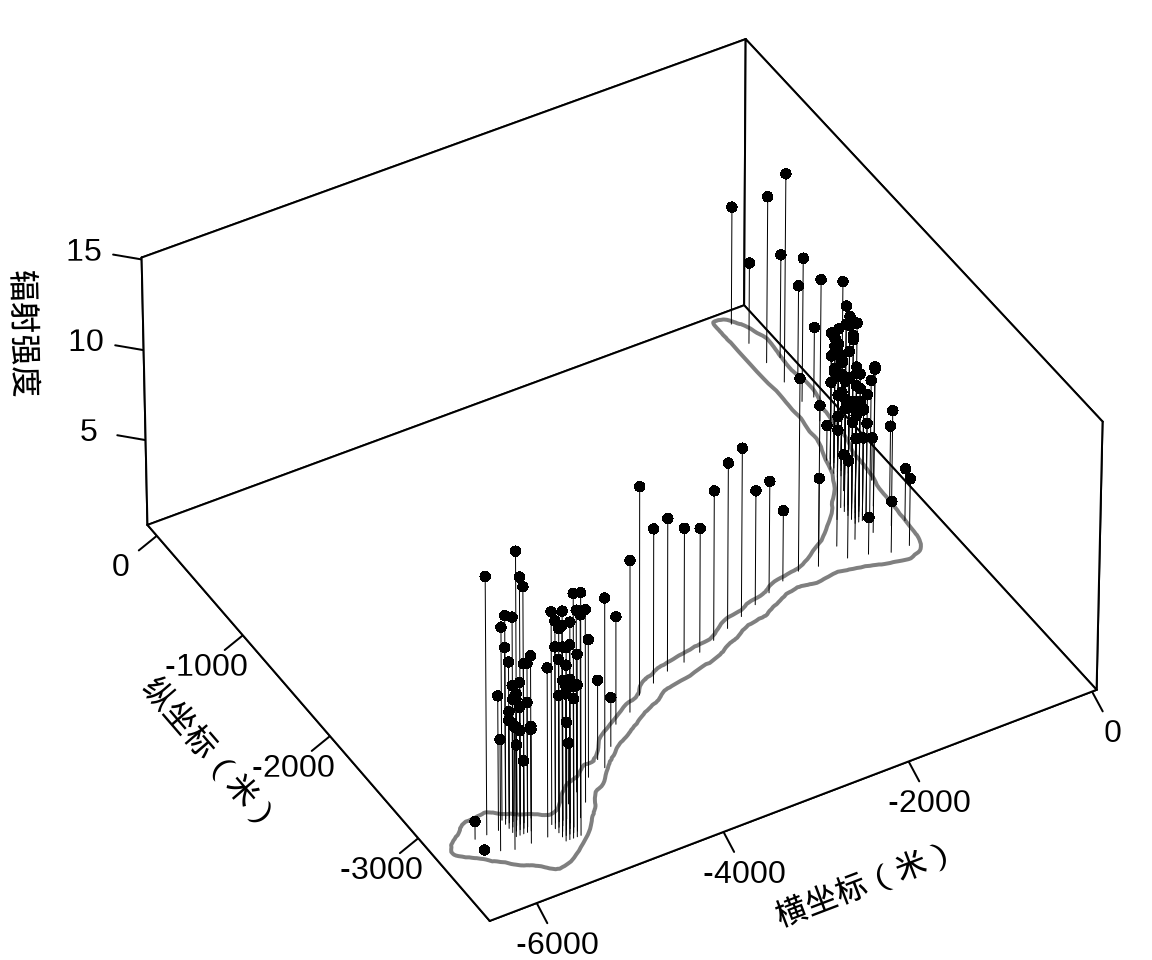
代码
library(plot3D)
with(rongelap, {
  opar <- par(mar = c(.1, 2.5, .1, .1), no.readonly = TRUE)
  rongelap_coastline$cZ <- 0
  scatter3D(
    x = cX, y = cY, z = counts / time,
    xlim = c(-6500, 50), ylim = c(-3800, 110),
    xlab = "\n横坐标(米)", ylab = "\n纵坐标(米)",
    zlab = "\n辐射强度", lwd = 0.5, cex = 0.8,
    pch = 16, type = "h", ticktype = "detailed",
    phi = 40, theta = -30, r = 50, d = 1,
    expand = 0.5, box = TRUE, bty = "b",
    colkey = F, col = "black",
    panel.first = function(trans) {
      XY <- trans3D(
        x = rongelap_coastline$cX,
        y = rongelap_coastline$cY,
        z = rongelap_coastline$cZ,
        pmat = trans
      )
      lines(XY, col = "gray50", lwd = 2)
    }
  )
  rongelap_coastline$cZ <- NULL
  on.exit(par(opar), add = TRUE)
})
近似高斯过程、高斯过程的核函数,mgcv 包的函数 s() 帮助文档参数的说明,默认值是梅隆型相关函数及默认的范围参数,作者自己定义了一套符号约定
library(nlme)
library(mgcv)
fit_rongelap_gam <- gam(
  counts ~ s(cX, cY, bs = "gp", k = 50), offset = log(time),
  data = rongelap, family = poisson(link = "log")
)
# 模型输出
summary(fit_rongelap_gam)
Family: poisson
Link function: log

Formula:
counts ~ s(cX, cY, bs = "gp", k = 50)

Parametric coefficients:
            Estimate Std. Error z value Pr(>|z|)
(Intercept) 1.976815   0.001642    1204   <2e-16 ***
---
Signif. codes:  0 '***' 0.001 '**' 0.01 '*' 0.05 '.' 0.1 ' ' 1

Approximate significance of smooth terms:
           edf Ref.df Chi.sq p-value
s(cX,cY) 48.98     49  34030  <2e-16 ***
---
Signif. codes:  0 '***' 0.001 '**' 0.01 '*' 0.05 '.' 0.1 ' ' 1

R-sq.(adj) =  0.876   Deviance explained = 60.7%
UBRE = 153.78 Scale est. = 1 n = 157s(cX,cY)
2543.376 参数 m 接受一个向量, m[1] 取值为 1 至 5,分别代表球型 spherical, 幂指数 power exponential 和梅隆型 Matern with \(\kappa\) = 1.5, 2.5 or 3.5 等 5 种相关/核函数。
Linking to GEOS 3.11.1, GDAL 3.6.4, PROJ 9.1.1; sf_use_s2() is TRUElibrary(abind)
library(stars)
# 类型转化
rongelap_sf <- st_as_sf(rongelap, coords = c("cX", "cY"), dim = "XY")
rongelap_coastline_sf <- st_as_sf(rongelap_coastline, coords = c("cX", "cY"), dim = "XY")
rongelap_coastline_sfp <- st_cast(st_combine(st_geometry(rongelap_coastline_sf)), "POLYGON")
# 添加缓冲区
rongelap_coastline_buffer <- st_buffer(rongelap_coastline_sfp, dist = 50)
# 构造带边界约束的网格
rongelap_coastline_grid <- st_make_grid(rongelap_coastline_buffer, n = c(150, 75))
# 将 sfc 类型转化为 sf 类型
rongelap_coastline_grid <- st_as_sf(rongelap_coastline_grid)
rongelap_coastline_buffer <- st_as_sf(rongelap_coastline_buffer)
rongelap_grid <- rongelap_coastline_grid[rongelap_coastline_buffer, op = st_intersects]
# 计算网格中心点坐标
rongelap_grid_centroid <- st_centroid(rongelap_grid)
# 共计 1612 个预测点
rongelap_grid_df <- as.data.frame(st_coordinates(rongelap_grid_centroid))
colnames(rongelap_grid_df) <- c("cX", "cY")
# 预测
rongelap_grid_df$ypred <- as.vector(predict(fit_rongelap_gam, newdata = rongelap_grid_df, type = "response"))
# 整理预测数据
rongelap_grid_sf <- st_as_sf(rongelap_grid_df, coords = c("cX", "cY"), dim = "XY")
rongelap_grid_stars <- st_rasterize(rongelap_grid_sf, nx = 150, ny = 75)
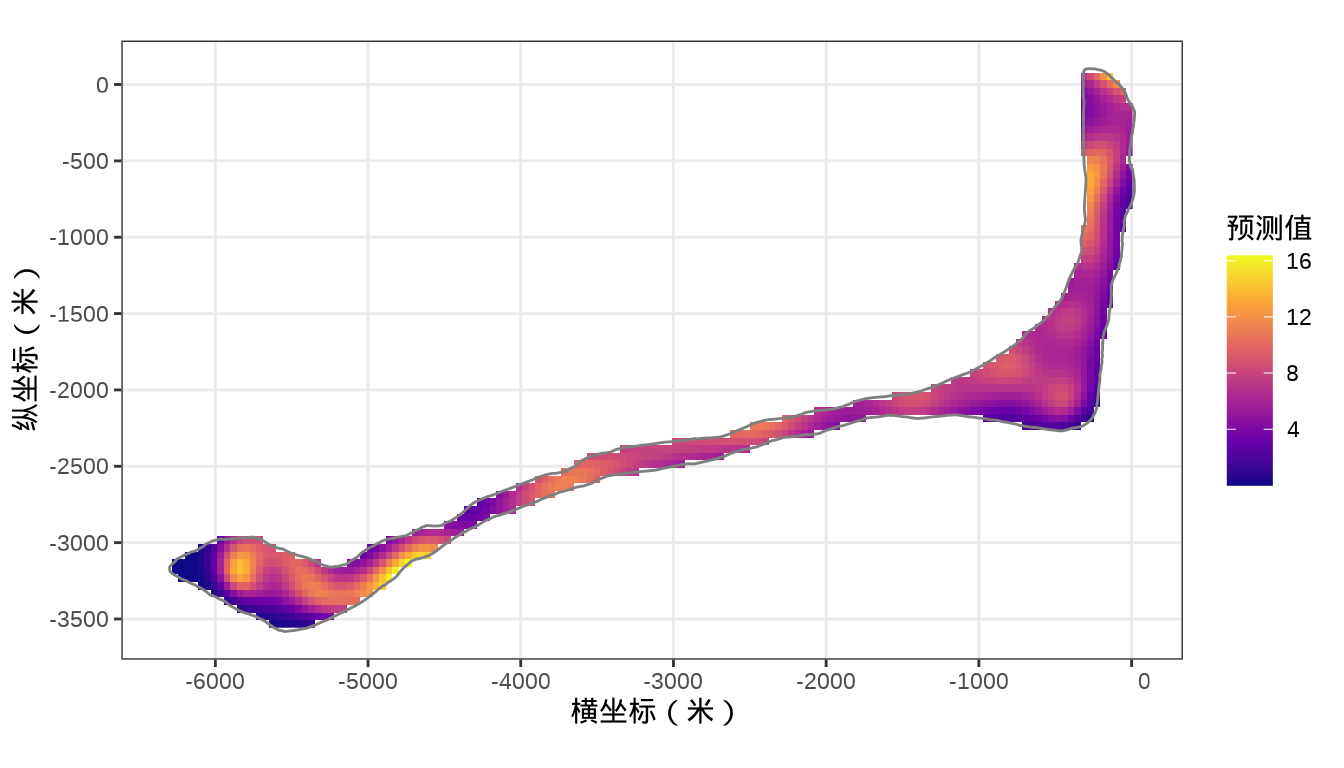
rongelap_stars <- st_crop(x = rongelap_grid_stars, y = rongelap_coastline_sfp)核辐射强度的空间分布
代码

32.3.1.2 mgcv (INLA)
mgcv 包的函数 ginla() 实现简化版 INLA
其中, \(k = 50\) 表示 50 个参数
32.3.2 贝叶斯派
32.3.2.1 brms
参考 brms 包的函数 gp() / s() 和 mgcv 包的函数 gamm() 的帮助文档,先用模拟数据检测
mgcv 包的函数 gamSim() 专门用于模拟数据。
参数 \(n=90\) 设置样本量,参数 dist = "normal" 设置变量分布,参数 eg 设置模拟数据的生成模型,取值如下
- Gu and Wahba 4 univariate term example.
- A smooth function of 2 variables.
- Example with continuous by variable.
- Example with factor by variable.
- An additive example plus a factor variable.
- Additive + random effect.
- As 1 but with correlated covariates.
'data.frame':   90 obs. of  8 variables:
 $ y  : num  4.613 1.732 2.621 9.62 0.394 ...
 $ x0 : num  0.658 0.868 0.78 0.765 0.187 ...
 $ x1 : num  0.366 0.239 0.414 0.94 0.156 ...
 $ x2 : num  0.6233 0.0373 0.0553 0.2346 0.3442 ...
 $ fac: Factor w/ 3 levels "1","2","3": 2 1 1 3 1 1 2 3 1 1 ...
 $ f1 : num  1.852 0.234 0.346 1.344 1.765 ...
 $ f2 : num  -0.28 -2.68 -2.64 -2.16 -1.77 ...
 $ f3 : num  3.292 0.354 0.959 8.914 6.128 ...
模拟分组的高斯过程
32.3.2.2 INLA
与 Stan 不同,INLA 包做近似贝叶斯推断,计算效率很高。
根据研究区域的边界构造非凸的内外边界,处理边界效应。
library(INLA)
library(splancs)
# 构造非凸的边界
boundary <- list(
  inla.nonconvex.hull(
    points = as.matrix(rongelap_coastline[,c("cX", "cY")]),
    convex = 100, concave = 150, resolution = 100),
  inla.nonconvex.hull(
    points = as.matrix(rongelap_coastline[,c("cX", "cY")]),
    convex = 200, concave = 200, resolution = 200)
)
根据研究区域的情况构造网格,边界内部三角网格最大边长为 300,边界外部最大边长为 600,边界外凸出距离为 100 米。
构建 SPDE,指定自协方差函数为指数型,则 \(\nu = 1/2\) ,因是二维平面,则 \(d = 2\) ,根据 \(\alpha = \nu + d/2\) ,从而 alpha = 3/2 。
生成 SPDE 模型的指标集,也是随机效应部分。
      s s.group  s.repl
    691     691     691
投影矩阵,三角网格和采样点坐标之间的投影。观测数据 rongelap 和未采样待预测的位置数据 rongelap_grid_df
# 观测位置投影到三角网格上
A <- inla.spde.make.A(mesh = mesh, loc = as.matrix(rongelap[, c("cX", "cY")]) )
# 预测位置投影到三角网格上
coop <- as.matrix(rongelap_grid_df[, c("cX", "cY")])
Ap <- inla.spde.make.A(mesh = mesh, loc = coop)
# 1612 个预测位置
dim(Ap)
[1] 1612 691# 在采样点的位置上估计 estimation stk.e
stk.e <- inla.stack(
tag = "est",
data = list(y = rongelap$counts, E = rongelap$time),
A = A,
effects = list(s = indexs)
)
# 在新生成的位置上预测 prediction stk.p
stk.p <- inla.stack(
tag = "pred",
data = list(y = NA, E = NA),
A = Ap,
effects = list(s = indexs)
)
# 合并数据 stk.full has stk.e and stk.p
stk.full <- inla.stack(stk.e, stk.p)指定模型
# 模型拟合
res <- inla(formula = y ~ f(s, model = spde),
  data = inla.stack.data(stk.full),
  E = E, # E 已知漂移项
  control.family = list(link = "log"),
  control.predictor = list(
    compute = TRUE,
    link = 1, # 与 control.family 联系函数相同
    A = inla.stack.A(stk.full)
  ),
  control.compute = list(
    cpo = TRUE,
    waic = TRUE, # WAIC 统计量 通用信息准则
    dic = TRUE   # DIC 统计量 偏差信息准则
  ),
  family = "poisson"
)
Warning in inla.core(formula = formula, family = family, contrasts = contrasts, : The A-matrix in the predictor (see ?control.predictor) is specified
but an intercept is in the formula. This will likely result
in the intercept being applied multiple times in the model, and is likely
not what you want. See ?inla.stack for more information.
You can remove the intercept adding ``-1'' to the formula.
Call:
   c("inla.core(formula = formula, family = family, contrasts = contrasts,
   ", " data = data, quantiles = quantiles, E = E, offset = offset, ", "
   scale = scale, weights = weights, Ntrials = Ntrials, strata = strata,
   ", " lp.scale = lp.scale, link.covariates = link.covariates, verbose =
   verbose, ", " lincomb = lincomb, selection = selection, control.compute
   = control.compute, ", " control.predictor = control.predictor,
   control.family = control.family, ", " control.inla = control.inla,
   control.fixed = control.fixed, ", " control.mode = control.mode,
   control.expert = control.expert, ", " control.hazard = control.hazard,
   control.lincomb = control.lincomb, ", " control.update =
   control.update, control.lp.scale = control.lp.scale, ", "
   control.pardiso = control.pardiso, only.hyperparam = only.hyperparam,
   ", " inla.call = inla.call, inla.arg = inla.arg, num.threads =
   num.threads, ", " keep = keep, working.directory = working.directory,
   silent = silent, ", " inla.mode = inla.mode, safe = FALSE, debug =
   debug, .parent.frame = .parent.frame)" )
Time used:
    Pre = 1.09, Running = 1.71, Post = 0.0644, Total = 2.86
Fixed effects:
             mean    sd 0.025quant 0.5quant 0.975quant  mode kld
(Intercept) 1.828 0.061      1.706    1.828      1.948 1.828   0

Random effects:
  Name    Model
    s SPDE2 model

Model hyperparameters:
              mean    sd 0.025quant 0.5quant 0.975quant  mode
Theta1 for s  2.00 0.062       1.88     2.00       2.12  2.00
Theta2 for s -4.85 0.129      -5.11    -4.85      -4.60 -4.85

Deviance Information Criterion (DIC) ...............: 1834.57
Deviance Information Criterion (DIC, saturated) ....: 314.90
Effective number of parameters .....................: 156.46

Watanabe-Akaike information criterion (WAIC) ...: 1789.31
Effective number of parameters .................: 80.06

Marginal log-Likelihood:  -1327.58
CPO, PIT is computed
Posterior summaries for the linear predictor and the fitted values are computed
(Posterior marginals needs also 'control.compute=list(return.marginals.predictor=TRUE)')
kld 表示 Kullback-Leibler divergence (KLD) 它的值描述标准高斯分布与 Simplified Laplace Approximation 之间的差别,值越小越表示拉普拉斯的近似效果好。
DIC 和 WAIC 指标都是评估模型预测表现的。另外,还有两个量计算出来了,但是没有显示,分别是 CPO 和 PIT 。CPO 表示 Conditional Predictive Ordinate (CPO),PIT 表示 Probability Integral Transforms (PIT) 。
固定效应和超参数部分
                mean         sd 0.025quant 0.5quant 0.975quant     mode
(Intercept) 1.828062 0.06149408   1.706414  1.82832   1.948243 1.828315
                     kld
(Intercept) 1.787568e-08 mean sd 0.025quant 0.5quant 0.975quant mode
Theta1 for s 2.000472 0.06237472 1.876913 2.000732 2.122506 2.001821
Theta2 for s -4.851585 0.12891915 -5.104742 -4.851808 -4.597130 -4.852737预测数据
# 预测值对应的指标集合
index <- inla.stack.index(stk.full, tag = "pred")$data
# 提取预测结果,后验均值
# pred_mean <- res$summary.fitted.values[index, "mean"]
# 95% 预测下限
# pred_ll <- res$summary.fitted.values[index, "0.025quant"]
# 95% 预测上限
# pred_ul <- res$summary.fitted.values[index, "0.975quant"]
# 整理数据
rongelap_grid_df$ypred <- res$summary.fitted.values[index, "mean"]
# 预测值数据
rongelap_grid_sf <- st_as_sf(rongelap_grid_df, coords = c("cX", "cY"), dim = "XY")
rongelap_grid_stars <- st_rasterize(rongelap_grid_sf, nx = 150, ny = 75)
rongelap_stars <- st_crop(x = rongelap_grid_stars, y = rongelap_coastline_sfp)
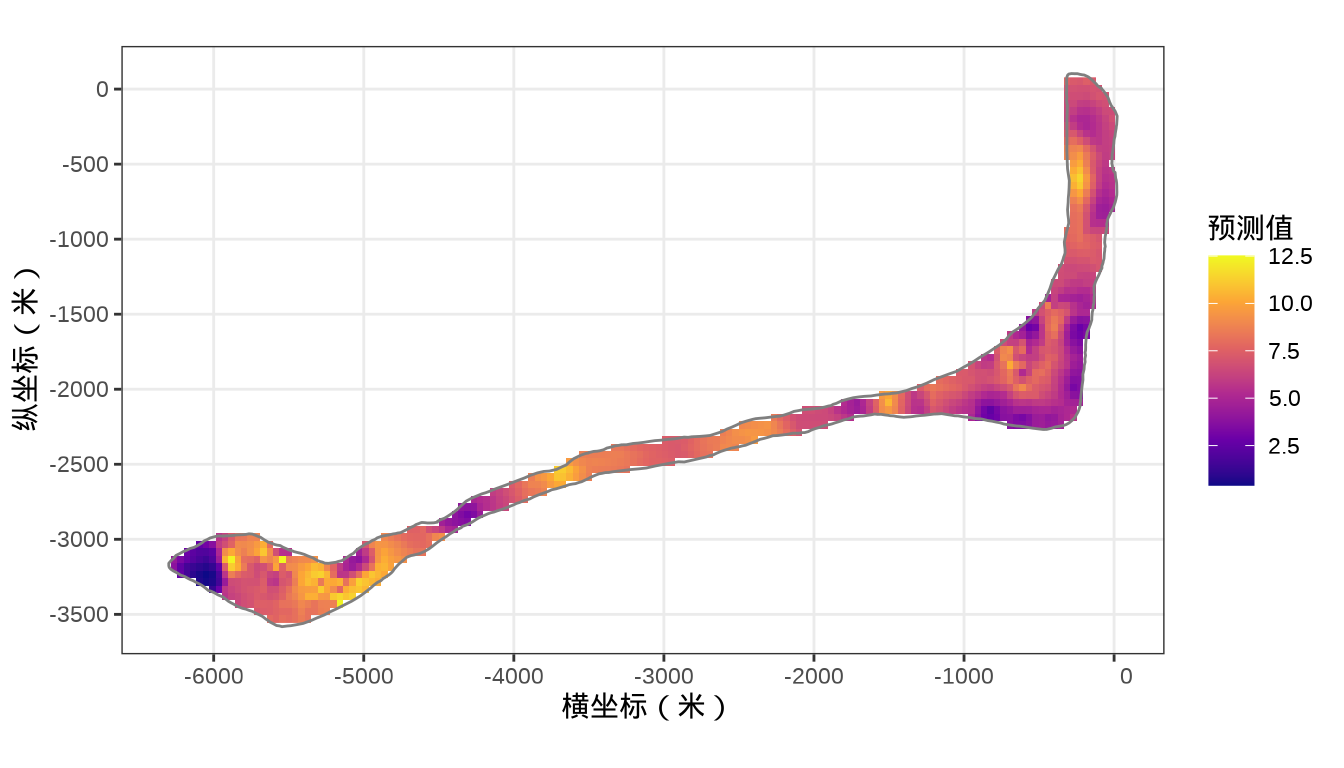
预测结果
32.4 总结
通过对频率派和贝叶斯派方法的比较,发现一些有意思的结果。
32.5 习题
-
MASS 包的地形数据集 topo 为例,高斯过程回归模型
代码
data(topo, package = "MASS") set.seed(20232023) nchains <- 2 # 2 条迭代链 # 给每条链设置不同的参数初始值 inits_data_gaussian <- lapply(1:nchains, function(i) { list( beta = rnorm(1), sigma = runif(1), phi = runif(1), tau = runif(1) ) }) # 预测区域网格化 nx <- ny <- 27 topo_grid_df <- expand.grid( x = seq(from = 0, to = 6.5, length.out = nx), y = seq(from = 0, to = 6.5, length.out = ny) ) # 对数高斯模型 topo_gaussian_d <- list( N1 = nrow(topo), # 观测记录的条数 N2 = nrow(topo_grid_df), D = 2, # 2 维坐标 x1 = topo[, c("x", "y")], # N x 2 坐标矩阵 x2 = topo_grid_df[, c("x", "y")], y1 = topo[, "z"] # N 向量 ) library(cmdstanr) # 编码 mod_topo_gaussian <- cmdstan_model( stan_file = "code/gaussian_process_pred.stan", compile = TRUE, cpp_options = list(stan_threads = TRUE) ) # 高斯过程回归模型 fit_topo_gaussian <- mod_topo_gaussian$sample( data = topo_gaussian_d, # 观测数据 init = inits_data_gaussian, # 迭代初值 iter_warmup = 500, # 每条链预处理迭代次数 iter_sampling = 1000, # 每条链总迭代次数 chains = nchains, # 马尔科夫链的数目 parallel_chains = 2, # 指定 CPU 核心数,可以给每条链分配一个 threads_per_chain = 1, # 每条链设置一个线程 show_messages = FALSE, # 不显示迭代的中间过程 refresh = 0, # 不显示采样的进度 output_dir = "data-raw/", seed = 20232023 ) # 诊断 fit_topo_gaussian$diagnostic_summary() # 对数高斯模型 fit_topo_gaussian$summary( variables = c("lp__", "beta", "sigma", "phi", "tau"), .num_args = list(sigfig = 4, notation = "dec") ) # 未采样的位置的预测值 ypred <- fit_topo_gaussian$summary(variables = "ypred", "mean") # 预测值 topo_grid_df$ypred <- ypred$mean # 整理数据 library(sf) topo_grid_sf <- st_as_sf(topo_grid_df, coords = c("x", "y"), dim = "XY") library(stars) # 26x26 的网格 topo_grid_stars <- st_rasterize(topo_grid_sf, nx = 26, ny = 26) library(ggplot2) ggplot() + geom_stars(data = topo_grid_stars, aes(fill = ypred)) + scale_fill_viridis_c(option = "C") + theme_bw() -
用 brms 包实现贝叶斯高斯过程回归模型,考虑用样条近似高斯过程以加快计算。提示:brms 包的函数
gp()的参数 \(k\) 表示近似高斯过程 GP 所用的基函数的数目。截止写作时间,brms 包实现的高斯过程核函数只有指数二次核函数 exponentiated-quadratic kernel 。# 高斯过程近似计算 bgamm2 <- brms::brm( z ~ gp(x, y, cov = "exp_quad", c = 5 / 4, k = 50), data = topo, chains = 2, seed = 20232023, warmup = 1000, iter = 2000, thin = 1, refresh = 0, control = list(adapt_delta = 0.99) ) # 输出结果 summary(bgamm2) # 条件效应 me3 <- brms::conditional_effects(bgamm1, ndraws = 200, spaghetti = TRUE) # 绘制图形 plot(me3, ask = FALSE, points = TRUE)
